
Maps, especially those included in digital exhibits, allow for relationships and movements to be depicted. Some essential things to consider before you start creating a map:
Consider who your target audience is and determine what language aligns with your intended audience.
What kind of text(s) will you incorporate into your map?
How complex will you make your map based on your intended audience?
How research and analytically heavy should it be?
What learning styles should you consider for your intended audience? Visual, auditory?
Will your map be interactive? You’ll want to understand what the context is of this map.
How will you balance between text and images in your map?
ArcGIS allows you to incorporate mapping, or GIS, geographic information. You can upload an existing map from the web or you can create your own map on the platform.
To get started, select the palette. Click “map.” It will allow you to start creating your map.
It will automatically connect your ArcGIS account to your StoryMaps account if you use the same email address for each account.
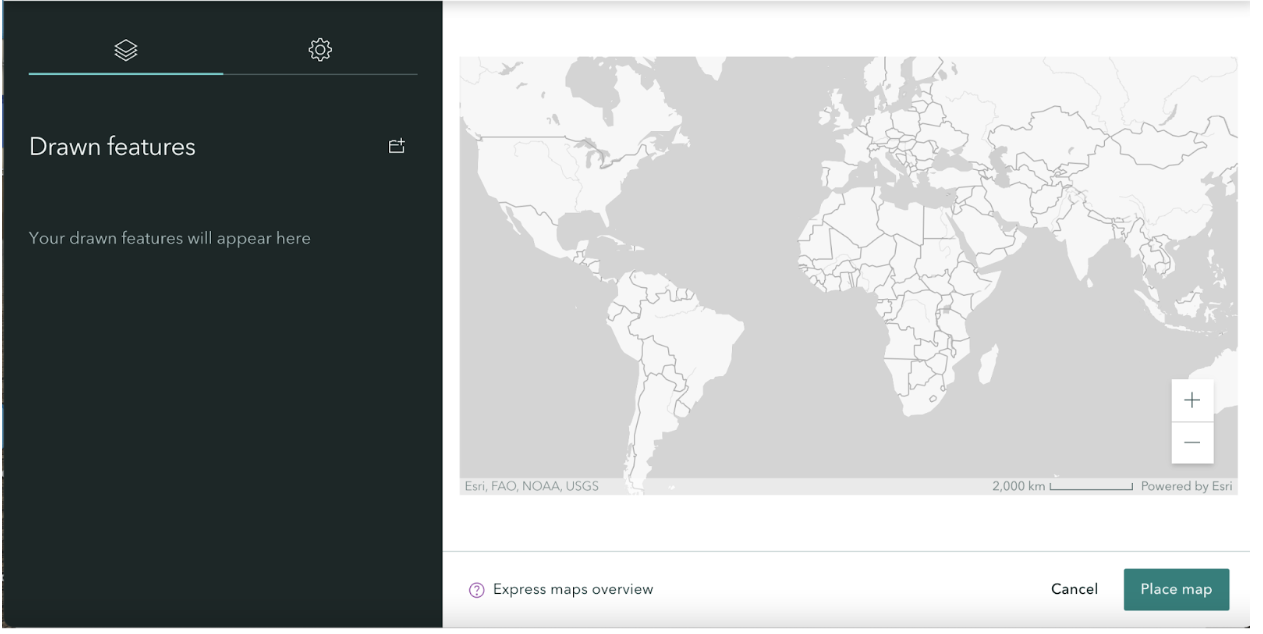
It will take you to this page:
First, select “new express map”
You can select your layout type in “settings.”
Adding Latitude and Longitude:
StoryMaps has a search feature that allows you to look for certain geographic locations. This is helpful if you want to find the latitude and longitude of certain areas. You find your current location relative to the area you want to map.
To create the points on your map:
First, select “point.”
Then, enter the latitude and longitude coordinates for the location you want to map in: “search by location.”
Next, select “Add to Map.” Once you click that, you can begin to insert information about that geographic location.
You can add an image by selecting “Add Image.”
You can download an image from the web or upload one from your computer. Now you will have an image for that point. StoryMaps automatically selects the latitude and longitude as the title. But, you can remove it and enter your own title. You can write a description under “Description.”
You can change the color of the points under “Style.” This feature is helpful in case you want to differentiate between certain points.
You can enter more than one location. You can use this feature to describe the relation between two or multiple points. Note the two locations on the map below:
To visually show a connection between two locations, you can use the “line” feature. Select “Line.”
and

This work is licensed under a Creative Commons Attribution-NonCommercial 4.0 Generic License.